ShmoopTube
Where Monty Python meets your 10th grade teacher.
Search Thousands of Shmoop Videos
Statistics and Probability Videos 134 videos
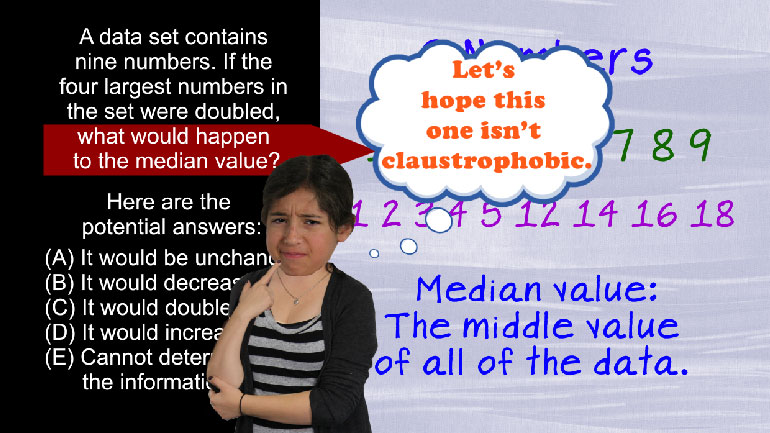
SAT Math: Statistics and Probability Drill 1, Problem 2. If the four largest numbers in the set were doubled, what would happen to the median...
SAT Math 1.4 Statistics and Probability. If two standard 6-sided dice are rolled, what is the probability that the sum of the dice will be gre...
SAT Math 1.5 Statistics and Probability. If Silas draws one card, then places it in his pocket and draws another, what is the probability that...
CAHSEE Math 2.4 Statistics, Data, and Probability I 183 Views
Share It!
Description:
Statistics, Data, and Probability I: Drill Set 2, Problem 4. Which of the following statements is true?
Transcript
- 00:03
Here's a boring, unshmoopy question you'll find on the exam...
- 00:07
Students in an Algebra 1 class took the following amount of time to finish a test.
- 00:12
Yep, another "can you read a chart" question. Check this out:
- 00:16
So the question asks... which of the following statements is true?
- 00:19
And here they are:
Full Transcript
- 00:27
So... when a question asks us anything like "which of the following are true",
- 00:31
it means we just have to roll up our sleeves and go one by one testing each little morsel
- 00:36
of hot dog they give us to evaluate. Let's just start with A.
- 00:39
It says, "more than half the students took between 15 and 45 minutes"
- 00:45
So then we just go back to the pie chart thing and see what it has to say.
- 00:49
Everything here is in percents, so to make things easier on ourselves, we can just think
- 00:53
about it as a number of students rather than some fancy fraction.
- 00:57
And in this case we can throw out answer A immediately because
- 01:00
57% took 45 minutes to an hour...
- 01:04
...that is, since over half DIDN'T fit in the 15 to 45 minute time window,
- 01:09
there's no way that more than half COULD.
- 01:12
We don't get brownie points for calculating that 10% took 15-30 minutes
- 01:16
and 23% took 30-45 minutes for a total of 33%.
- 01:22
So let's throw out A and move on as fast as we can.
- 01:25
B is sorta the counter-side of A.
- 01:28
It says LESS than half the students took 45 minutes to an hour to fnish...
- 01:33
...but we just noted that this number was 57% ... already OVER half.
- 01:38
So B is a quick easy toss out.
- 01:40
Move on to C.
- 01:41
C says: More than a quarter of the class took
- 01:43
EITHER 15 to 30 minutes to finish, OR did not finish the test at all.
- 01:49
So here, we've got a SUM. Meaning... we ADD both cases.
- 01:53
That's what happens when we have a conditional phrase like "OR".
- 01:57
As in... Hand me a condiment --
- 01:59
either that half gallon jug of ketchup OR that gallon jug of mustard.
- 02:04
So in the 15-30 minute group, we see that 10% of the students were captured here --
- 02:09
and then in the Did Not Finish group, we have 10% as well.
- 02:12
If we add them, we have a total of 20% of the students in those two groups.
- 02:17
So C is in fact only 20%, which is LESS than a quarter or 25%.
- 02:22
So C ain't cuttin' it for us either. Odds are very good D is the answer.
- 02:27
D says that more than a quarter of the class took between 15 and 45 minutes to finish.
- 02:33
Well, the 15-30 group was 10% - check.
- 02:36
And the 30-45 group was 23% - check.
- 02:40
ADD the two groups to get 33% and yeah -- woo hoo --
- 02:44
33% is in fact greater than a quarter or 25%
- 02:49
So the answer is, yes... we can read a pie chart. D.
- 02:53
Time for a slice.
Related Videos
Statistics, Data, and Probability I: Drill Set 3, Problem 4. How many different avatars can be created based on the given options?
CAHSEE Math: Algebra and Functions Drill 5, Problem 3. Solve the equation.
Statistics, Data, and Probability II Drill 3 Problem 2. Which two sports together make up for the preferences of more than half of all those w...
Statistics, Data, and Probability II Drill 3 Problem 3. One hundred twenty of those who were asked preferred what sport?
