ShmoopTube
Where Monty Python meets your 10th grade teacher.
Search Thousands of Shmoop Videos
Playlist CAHSEE Math Test Prep: Statistics, Data, and Probability II 30 videos
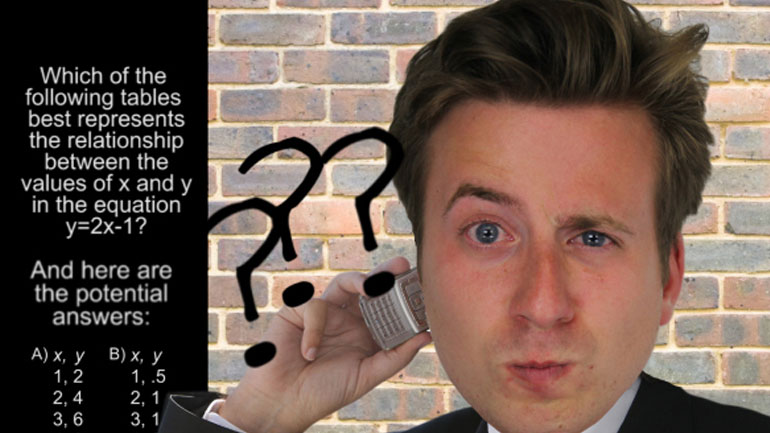
CAHSEE Math Statistics, Data, and Probability II: Drill 1 Problem 1. Which of the following tables best represents the relationship between the val...
Statistics, Data, and Probability II Drill 1, Problem 2. Based on the chart, which of the following statements is true?
CAHSEE Math Statistics, Data, and Probability II: Drill Set 1, Problem 3. Based on the following, which of the following statements is true?
CAHSEE Math 1.2 Statistics, Data, and Probability II 199 Views
Share It!
Description:
Statistics, Data, and Probability II Drill 1, Problem 2. Based on the chart, which of the following statements is true?
Transcript
- 00:03
Here’s your shmoop du jour…
- 00:06
Sharon has been worried lately that she spends too much of her time making pie charts.
- 00:11
So she’s decided to take stock of her life… in the form of a pie chart.
- 00:16
Baby steps there, Sharon.
- 00:18
The pie chart below shows Sharon's activities on a typical school day.
Full Transcript
- 00:22
Based on the chart, which of the following statements is true?
- 00:25
And here are the potential answers...
- 00:30
We are being asked to just read a graph and deal with a bunch of random questions which…
- 00:34
we really have to cover one by one.
- 00:36
So… as Nike suggests… let’s just do it.
- 00:40
Potential answer A:
- 00:42
Amount of time on homework: 13%
- 00:44
Amount of time on free time: 17%
- 00:47
Total 30%
- 00:49
Amount of time sleeping: 33%
- 00:52
So A is false – this girl must be beautiful – she certainly gets enough beauty sleep.
- 00:56
OK, try B.
- 00:58
Homework: 13%
- 00:59
Free time: 17%. Total 30%
- 01:02
Versus time spent at school: 25%. Clearly not equal.
- 01:07
OK, C.
- 01:08
Free time at 17% plus sports at 8% plus eating at 4% totals 29% - nope – she slept 33%
- 01:15
of the time so C is false as well.
- 01:18
D had better be true or we’re in bad shape.
- 01:22
D.
- 01:23
Homework: 13%, free time 17% is – yes – less than the 33% she spent sleeping.
- 01:29
So thank goodness… D is true.
- 01:31
As in… “Denial.”
Related Videos
CAHSEE Math: Algebra and Functions Drill 5, Problem 3. Solve the equation.
Statistics, Data, and Probability I: Drill Set 3, Problem 4. How many different avatars can be created based on the given options?
Statistics, Data, and Probability II Drill 3 Problem 2. Which two sports together make up for the preferences of more than half of all those w...
Statistics, Data, and Probability II Drill 3 Problem 3. One hundred twenty of those who were asked preferred what sport?
