ShmoopTube
Where Monty Python meets your 10th grade teacher.
Search Thousands of Shmoop Videos
Playlist ACT® Science Data Representation 25 videos
ACT Science: Data Representation Passage Drill 1, Problem 1. What do the statistics in Figure 1 suggest?
ACT Science: Data Representation Passage Drill 1, Problem 2. Which of the following is a variable in Figure 1, but not in Figure 2?
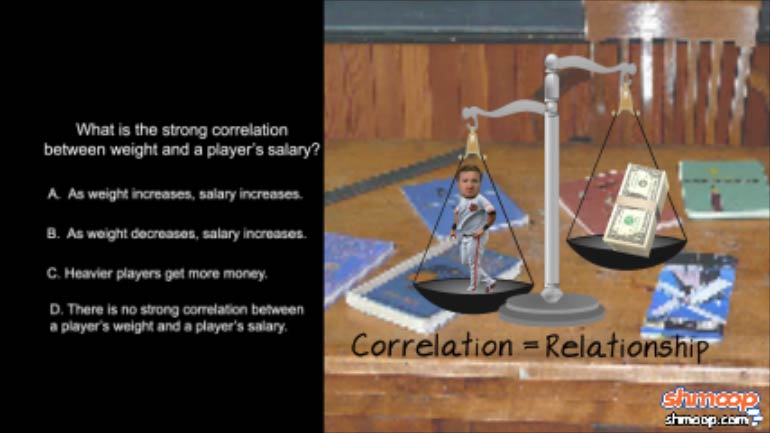
ACT Science: Data Representation Passage Drill 1, Problem 3. What is the strong correlation between weight and a player's salary?
Predicting Birth Dates 252 Views
Share It!
Description:
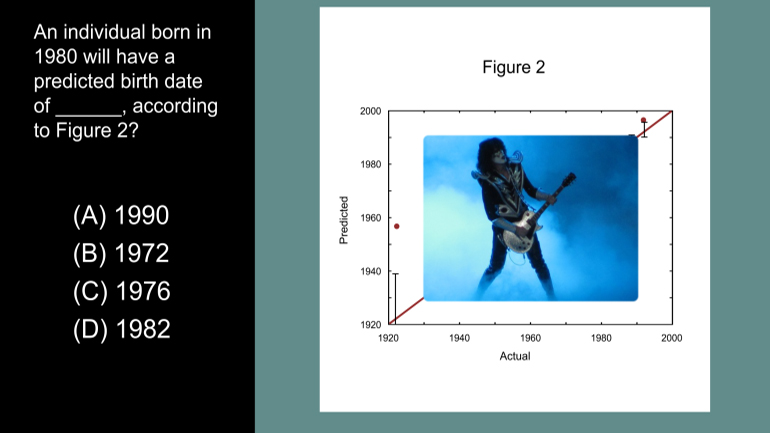
ACT Science Data Representation Passage: Drill 3, Problem 5. According to Figure 2, what birth date will be predicted for an individual actually born in 1980?
Transcript
- 00:03
Here's an unshmoopy question you'll find on a science exam somewhere in life...
- 00:07
Hope you're in a "reading" sort of mood.
- 00:09
Hit pause and familiarize yourself with the text and oh the pretty pictures...
- 00:27
An individual born in 1980 will have a predicted birth date of... what, according to Figure 2?
- 00:34
And here are the potential answers...
Full Transcript
- 00:44
Wow, bonus... this question already tells
- 00:46
us what figure we need to look at.
- 00:48
So if we scooch our eyeballs over to Figure 2...
- 00:51
...we can see that the predicted birth dates are pretty darn close to the actual birthdates...
- 00:57
...so we're looking for the year that's closest to 1980.
- 01:00
Out of all four answer choices, 1982 is the closest, so D is the right answer.
- 01:05
If we want to get fancy, the graph even shows us that the predicted values seem to be slightly
- 01:09
higher than the actual values.
- 01:12
And if we want to get really fancy...
- 01:14
...we can meet up tonight at Red Lobster. We call dibs on the Cheddar Bay Biscuits.
Related Videos
ACT Science: Data Representation Passage Drill 1, Problem 2. Which of the following is a variable in Figure 1, but not in Figure 2?
ACT Science: Data Representation Passage Drill 1, Problem 1. What do the statistics in Figure 1 suggest?
ACT Science: Data Representation Passage Drill 1, Problem 3. What is the strong correlation between weight and a player's salary?
ACT Science: Conflicting Viewpoint Passage Drill 1, Problem 1. What statement would both scientists agree upon?
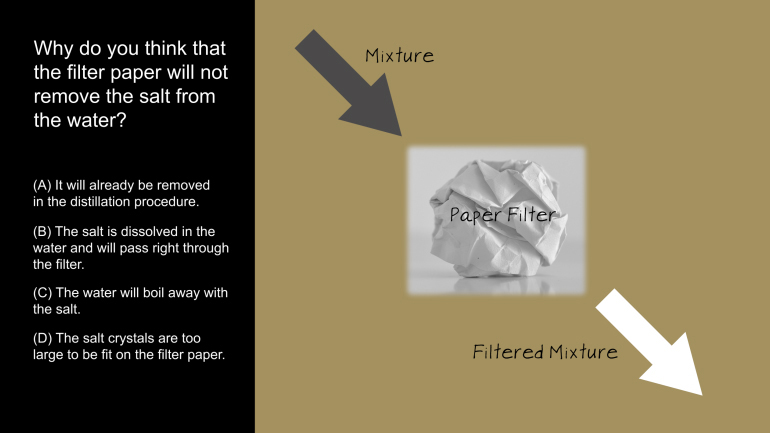
ACT Science: Research Summary Passage Drill 2, Problem 1. Why do you think that the filter paper will not remove the salt from the water?


