ShmoopTube
Where Monty Python meets your 10th grade teacher.
Search Thousands of Shmoop Videos
Playlist ACT® Science Data Representation 25 videos
ACT Science: Data Representation Passage Drill 1, Problem 1. What do the statistics in Figure 1 suggest?
ACT Science: Data Representation Passage Drill 1, Problem 2. Which of the following is a variable in Figure 1, but not in Figure 2?
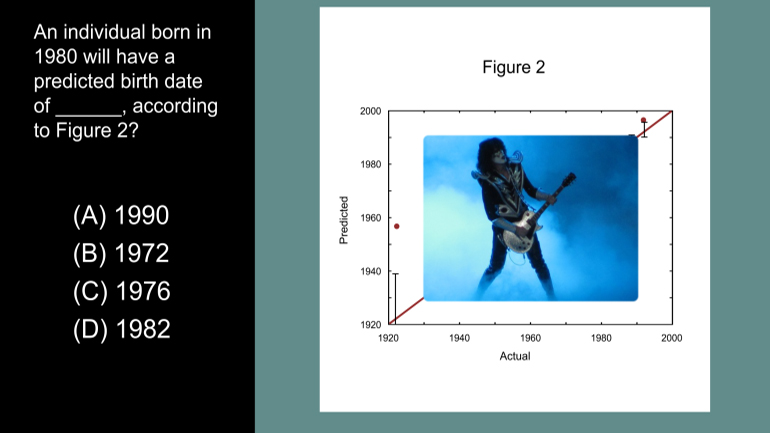
ACT Science: Data Representation Passage Drill 3, Problem 2. After what year in the graph is the scientist's model most accurate at predicting...
Atmospheric Carbon-14 212 Views
Share It!
Description:
ACT Science: Data Representation Passage Drill 3, Problem 4. Which of the following best describes the change in atmospheric 14 C after 1965?
Transcript
- 00:03
Here's your shmoop du jour, brought to you by diamonds.
- 00:07
They're just carbon that's really uptight.
- 00:25
Which of the following best describes the change in atmospheric 14C after 1965?
- 00:32
And here are your potential answers...
- 00:38
We've done this several times already...which figure should we use to solve the question?
Full Transcript
- 00:43
We're looking for the figure that shows changes in amounts of carbon-14...so we're definitely
- 00:48
looking at figure 1.
- 00:49
The question says "after 1965." So let's start by locating 1965 on both curves.
- 00:56
Next, we'll notice that after 1965, both lines start sloping downwards.
- 01:01
That means the change in 14C is decreasing, not increasing.
- 01:05
We can rule out choices (C) and (D) because both say increase. Now, all we have to do
- 01:10
is decide whether the trends are decreasing linearly or exponentially.
- 01:15
Linear means in a straight line, but neither of those curves look straight to us.
- 01:18
That is, after all, the definition of a curve, right?
- 01:20
That means that the change must be declining exponentially!
- 01:24
The correct answer is (B).
Related Videos
ACT Science Data Representation Passage: Drill 3, Problem 5. According to Figure 2, what birth date will be predicted for an individual actual...
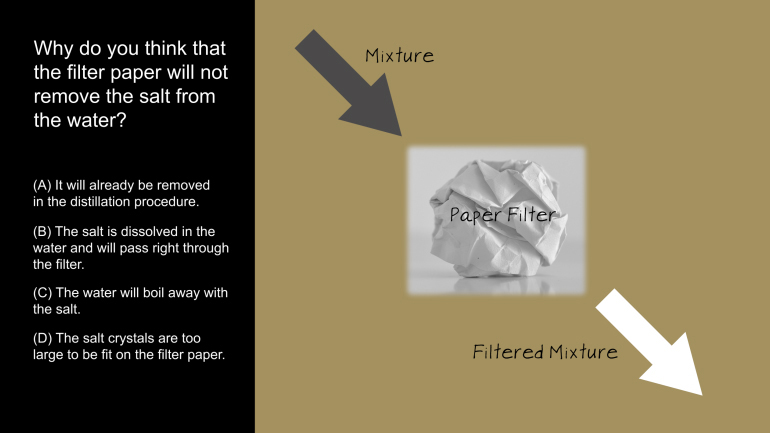
ACT Science: Research Summary Passage Drill 2, Problem 1. Why do you think that the filter paper will not remove the salt from the water?
ACT Science: Conflicting Viewpoint Passage Drill 1, Problem 1. What statement would both scientists agree upon?
ACT Science: Data Representation Passage Drill 1, Problem 1. What do the statistics in Figure 1 suggest?
ACT Science: Data Representation Passage Drill 1, Problem 2. Which of the following is a variable in Figure 1, but not in Figure 2?


