ShmoopTube
Where Monty Python meets your 10th grade teacher.
Search Thousands of Shmoop Videos
Charts, Graphs, and Tables Videos 60 videos
This video covers how to set up a stem and leaf plot and use it to find the mean and median of a set of numbers.
Knock-Knock. ¡Histograma cantante! Aquí para cantarte a tí acerca de toda la alegría y maravillas de lo que hacemos. ¿Te interesaría adquirir...
Univariate Data and Representations 3137 Views
Share It!
Description:
Time to learn about univariate data and representations. We know how to get a party started.
Transcript
- 00:03
univariate data a la shmoop. sometimes so much can be communicated by
- 00:09
a single word. just be sure there's actually a fire. all right well in math [man and woman watch sunset]
- 00:14
we have a term for that. univariate data. unit as in one. and variate as in
- 00:20
variable. it's a good way of keeping things simple and uncomplicated so we
- 00:25
can examine a single type of data and compare it to other data. so for example
Full Transcript
- 00:30
say someone conducted an experiment in which they tried to balance a bunch of
- 00:33
different items on different body parts for varying lengths of time while
- 00:37
standing in different positions. well there are a few balls in the air here. [man juggles large objects]
- 00:42
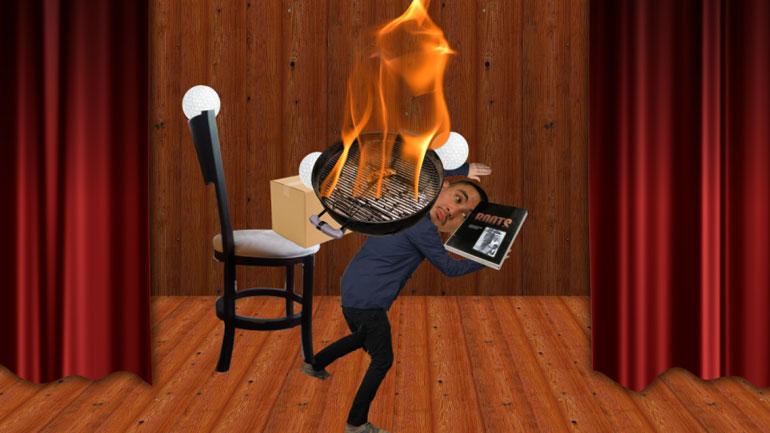
rather than worried about our guy balancing a lit grill on his right
- 00:46
shoulder for 20 minutes while standing on one leg we can instead zero in on the
- 00:50
item he's balancing .but we're really just looking at a list. it might read
- 00:54
holding chair teapot book show flat-screen television panda bear, and so
- 00:59
on. if you're dealing with chemicals that react with one another in a certain [list of household items]
- 01:03
temperature well you're gonna focus just on the types of chemicals or just on the
- 01:07
temperature but not both. either way please try to keep some focus
- 01:11
on the actual chemicals .and don't forget where the eyewash station is. okay if you
- 01:16
get a handle on things and want to go a level deeper there's always bivariate
- 01:20
data. now you can start bringing in a second variable into the mix here. if
- 01:24
you're looking at men and women of different ages who graduated from [person stirs vegetables in a frying pan]
- 01:28
various Clown colleges, well now you can track both the ages of the people and
- 01:32
the prestigious Clown colleges they attended. but bivariate data is a
- 01:38
different story for a different day. let's not get ahead of ourselves. so for
- 01:41
now slow down enjoy life and try to maintain some talent. [juggling man is knocked down by bear]
Related Videos
Statistics, Data, and Probability I: Drill Set 3, Problem 4. How many different avatars can be created based on the given options?
Statistics, Data, and Probability II Drill 3 Problem 2. Which two sports together make up for the preferences of more than half of all those w...
Statistics, Data, and Probability II Drill 3 Problem 3. One hundred twenty of those who were asked preferred what sport?
If you're looking for tips on how to score more free samples at Yogurtland, you've got the wrong video.
