ShmoopTube
Where Monty Python meets your 10th grade teacher.
Search Thousands of Shmoop Videos
Data Analysis Videos 14 videos
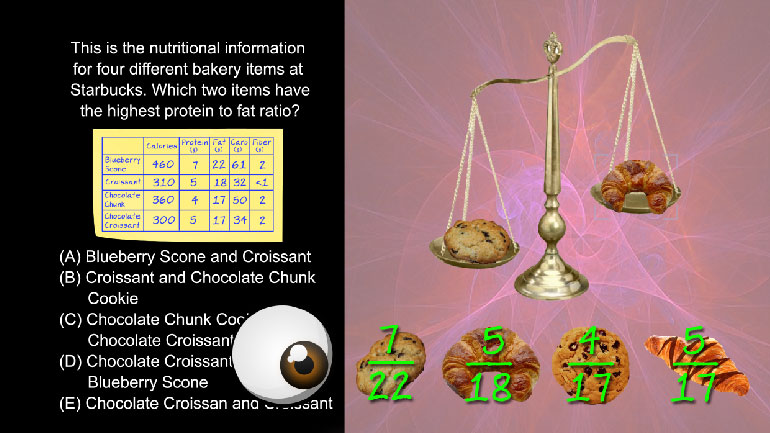
SAT Math 2.1 Statistics and Probability. Which two items have the highest protein to fat ratio?
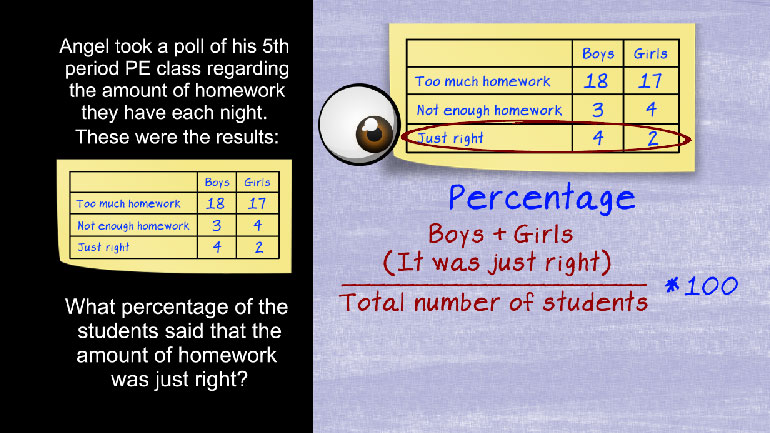
SAT Math 2.2 Statistics and Probability. What percent of her recommended daily intake of 2000 calories did she consume?
SAT Math 3.5 Statistics and Probability 256 Views
Share It!
Description:
SAT Math 3.5 Statistics and Probability
- Data Analysis / Data Interpretation
- Product Type / SAT Math
- Statistics and Probability / Summarize, represent, and interpret data on two variables
- Statistics and Probability / Summarize, represent, and interpret data on two variables
- Statistics and Probability / Interpret linear models
- Statistics and Probability / Make inferences and justify conclusions from sample surveys, experiments, and observational studies
- Functions / Interpret expressions for functions
- Statistics and Probability / Summarize, represent, and interpret data on two variables
- Statistics and Probability / Interpret linear models
- Statistics and Probability / Summarize, represent, and interpret data on two variables
- Statistics and Probability / Summarize, represent, and interpret data on two variables
- Statistics and Probability / Make inferences and justify conclusions
- Problem Solving and Data Analysis / Data collection and evaluation
Transcript
- 00:02
Time for your daily dose of Shmoop. Open wide!
- 00:06
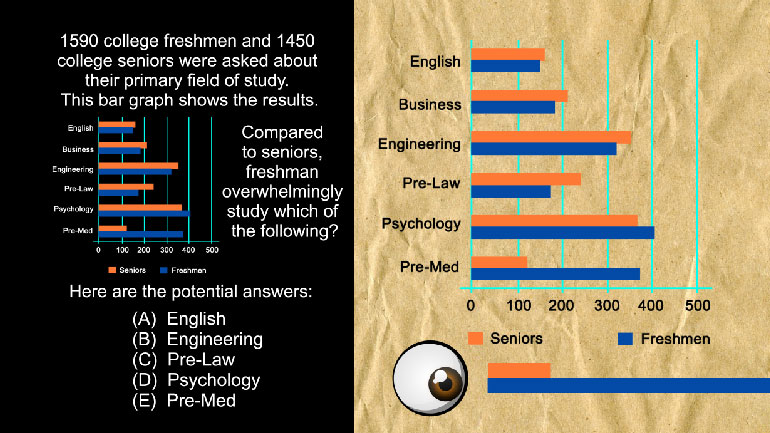
1590 college freshmen and 1450 college seniors were asked about their primary field of study.
- 00:12
This bar graph shows the results.
- 00:14
Compared to seniors, freshman overwhelmingly study which of the following?
- 00:18
And here are the potential answers…
Full Transcript
- 00:21
Ok, this question is testing whether or not we know how to read a graph.
- 00:25
Since freshmen are depicted in blue, and seniors are depicted in orange, as shown by the key on the right…
- 00:30
This kinda key.
- 00:33
…we need to look for the field of study where the blue bar far exceeds the length
- 00:36
of the orange bar to find which subject freshmen overwhelmingly study compared to seniors.
- 00:42
The subject that fits this description better than any other field of study in the graph is PreMed.
- 00:48
It’s…pretty obvious that this blue bar is way longer than this orange bar.
- 00:52
The correct answer is (E).
Related Videos
SAT Math 2.1 Geometry and Measurement. What is the measure of angle z in terms of x and y?
In 2014, the unemployment rate of one county in California was 7%. In another county, the unemployment rate was 11%. Which of the following express...
Angela is making cookies for a bake sale. She expects each batch of her cookies to sell for $40. It costs her $10 to make one batch of cookies, and...
