ShmoopTube
Where Monty Python meets your 10th grade teacher.
Search Thousands of Shmoop Videos
Exploring Data Videos 25 videos
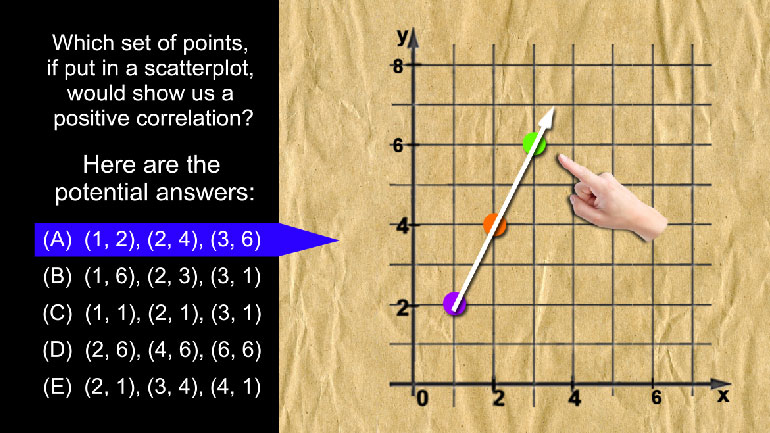
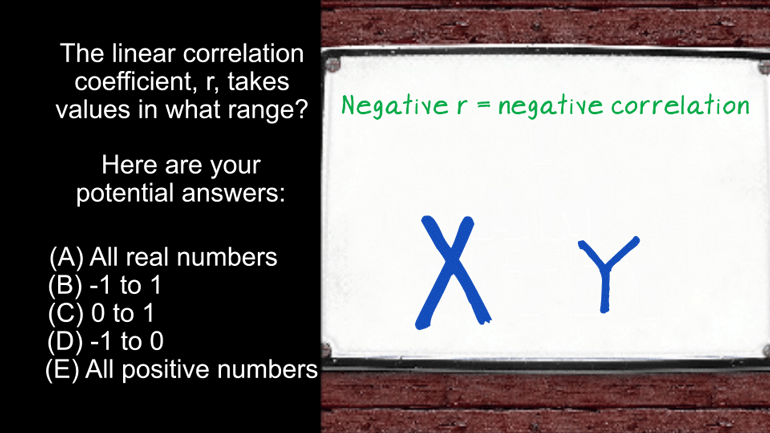
AP Statistics: Exploring Data Drill 2, Problem 3. Which set of points, if put in a scatterplot, would show us a positive correlation?
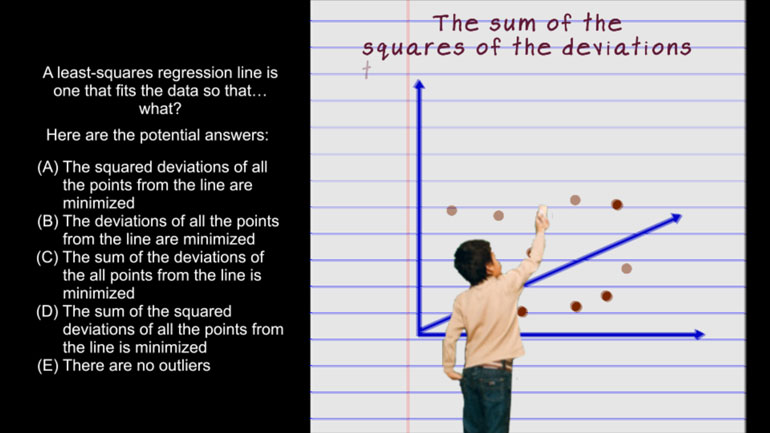
AP Statistics: Exploring Data Drill 1, Problem 2. Which of the following is the best way to display this type of data?
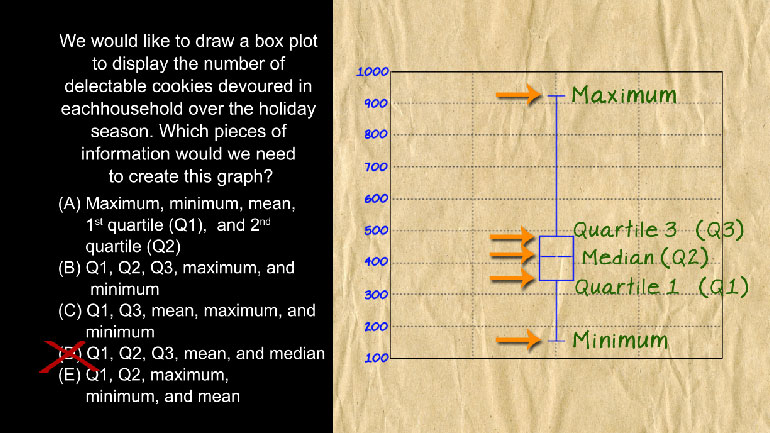
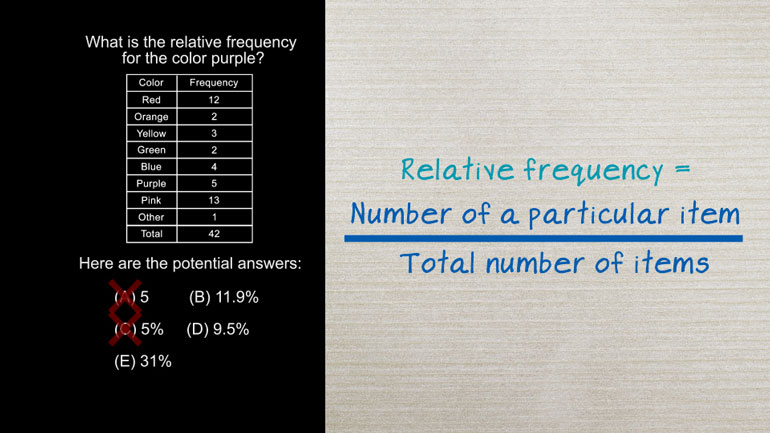
AP Statistics: Exploring Data Drill 1, Problem 5. Which pieces of information would we need to create this graph?
AP Statistics 3.3 Exploring Data 207 Views
Share It!
Description:
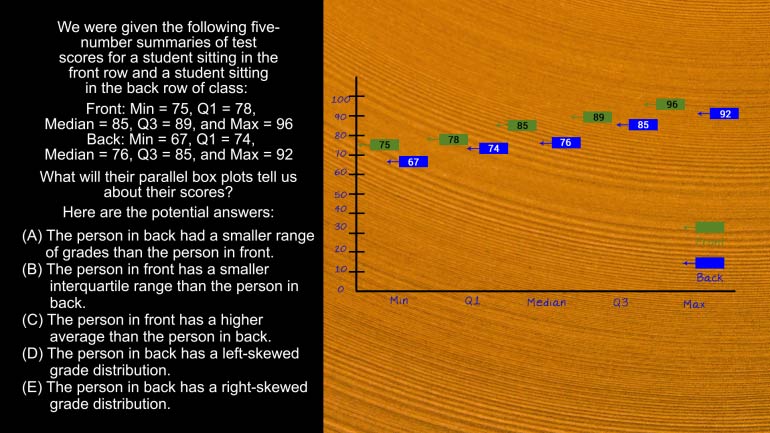
AP Statistics: Exploring Data Drill 3, Problem 3. What is the interquartile range?
Transcript
- 00:03
You have the right to remain shmoopy.
- 00:05
If your history test scores are 65, 71, 76, 79 and 87, what is the interquartile range?
- 00:11
And here are the potential answers...
- 00:15
We're given a bunch of test scores and we want to find the IQR, or interquartile range.
- 00:22
Remember that the IQR is the distance between
Full Transcript
- 00:24
Q1 and Q3 in the five number summary of a set of data.
- 00:28
As its name suggests, a five number summary... summarizes the data of 5 numbers.
- 00:35
Those five numbers are: minimum, q1, median,
- 00:39
q3, and maximum. It's obvious that minimum is the smallest,
- 00:43
and maximum is the biggest. Not too far off is median, which is the middle
- 00:46
value. Q1 is between the minimum and median, and Q3 is between the median and maximum.
- 00:52
So, to find our IQR, we'll want to subtract Q1 from Q3.
- 00:56
Since our data is only 5 values, it's easy to figure out the values we want for our 5
- 01:01
number summary. Then, it's a simple matter of subtracting
- 01:04
71 from 79 to get 8.
- 01:07
The IQR is 8, so our answer is (E).
Related Videos
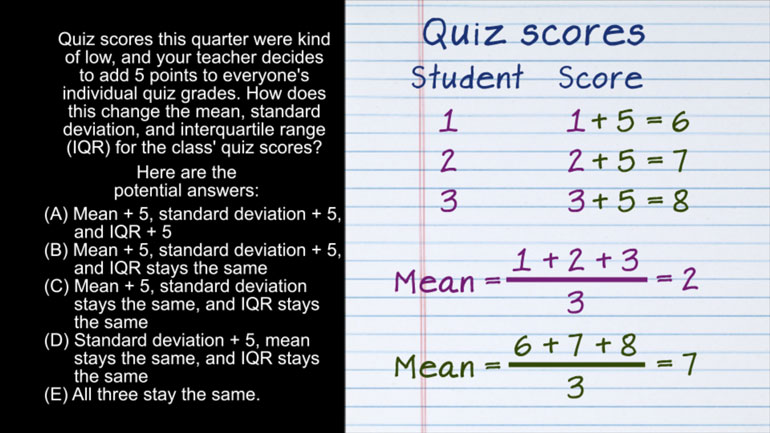
AP Statistics 2.1 Exploring Data. How does this change affect the mean, standard deviation, and IQR?
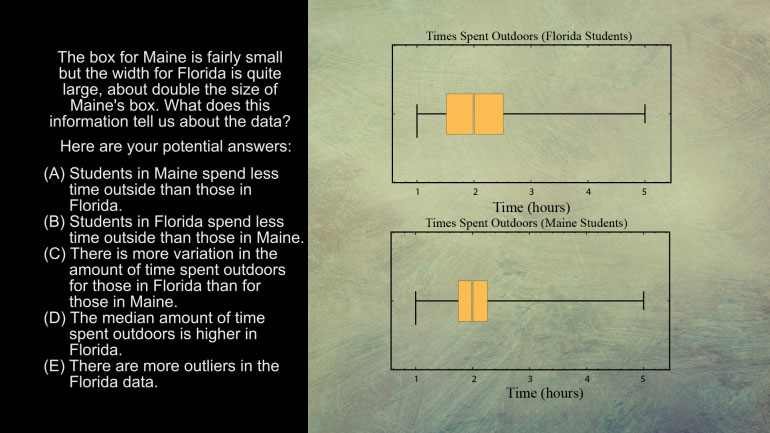
AP Statistics 5.1 Exploring Data. What does this information tell us about the data?
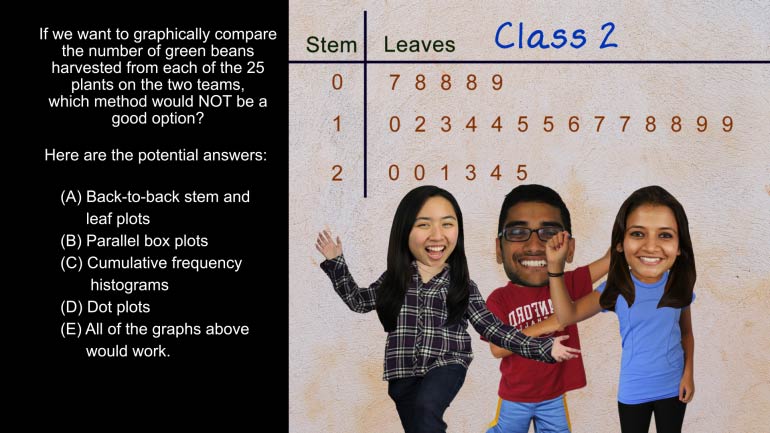
AP Statistics 5.2 Exploring Data. Which method would not be a good option?
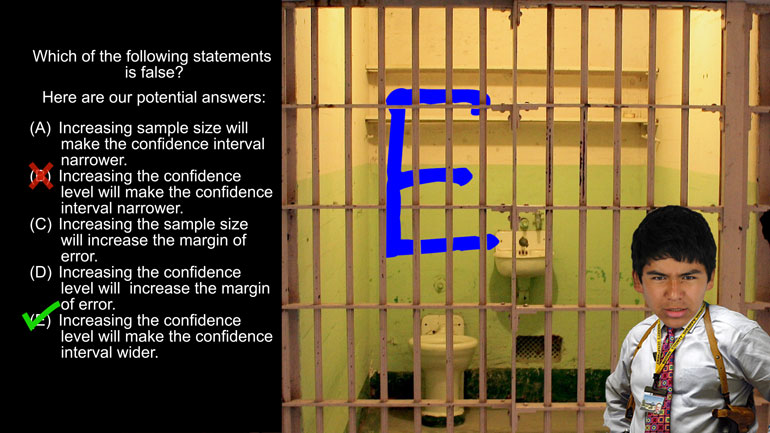
AP Statistics 1.5 Statistical Inference. Which of the following statements is false?
Want to pull an Oliver Twist and ask us for more? We've gotcha covered. Head over to /video/subjects/math/test-prep/ap-statistics/ for more AP...
