ShmoopTube
Where Monty Python meets your 10th grade teacher.
Search Thousands of Shmoop Videos
ACT Science Videos 67 videos
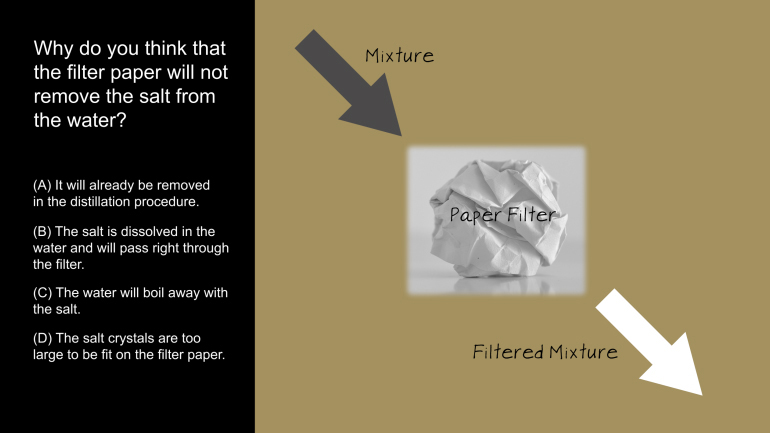
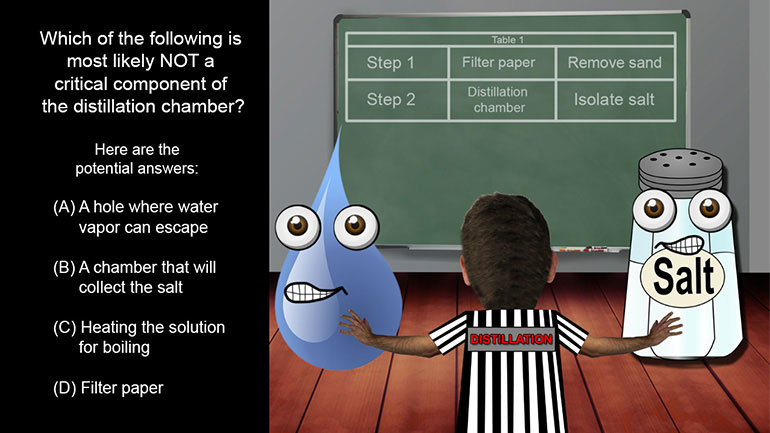
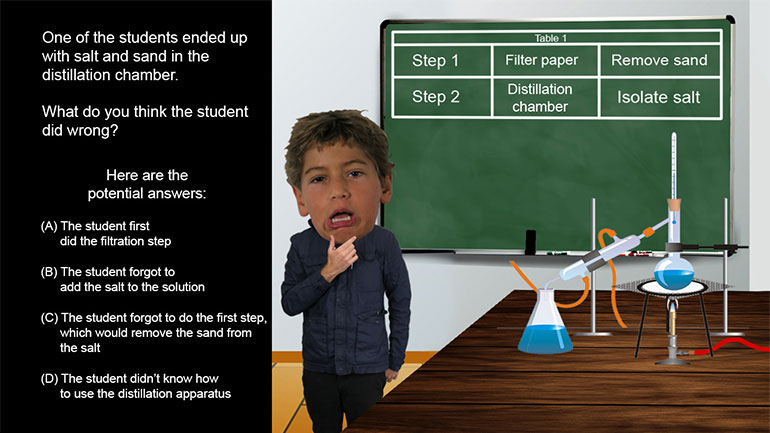
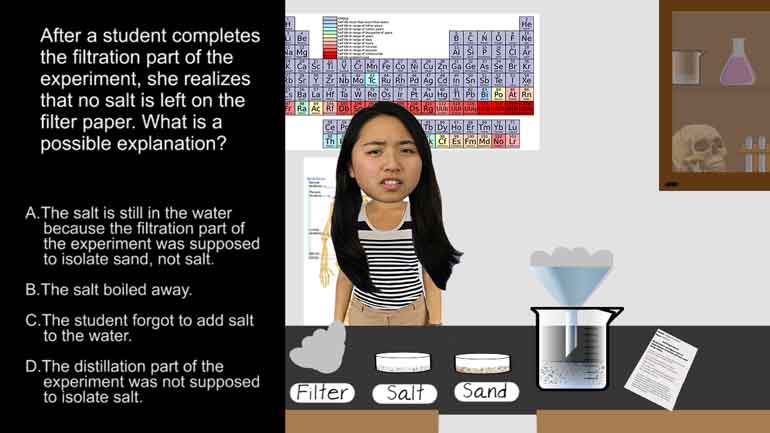
ACT Science: Research Summary Passage Drill 2, Problem 1. Why do you think that the filter paper will not remove the salt from the water?
ACT Science: Data Representation Passage Drill 1, Problem 1. What do the statistics in Figure 1 suggest?
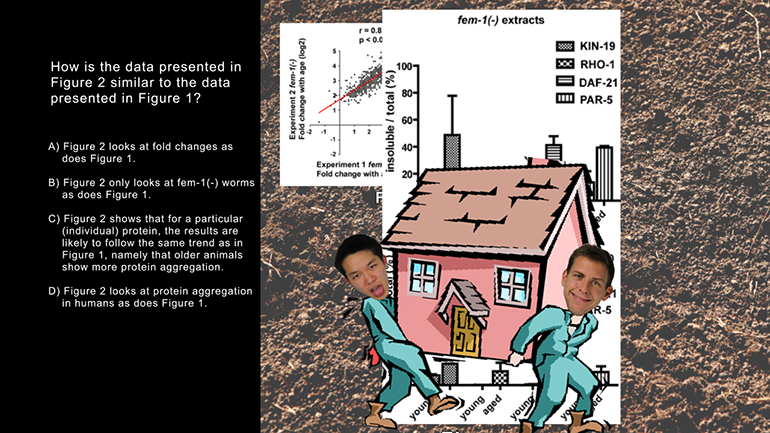
ACT Science: Data Representation Passage Drill 1, Problem 2. Which of the following is a variable in Figure 1, but not in Figure 2?
ACT Science 3.4 Research Summary Passage 187 Views
Share It!
Description:
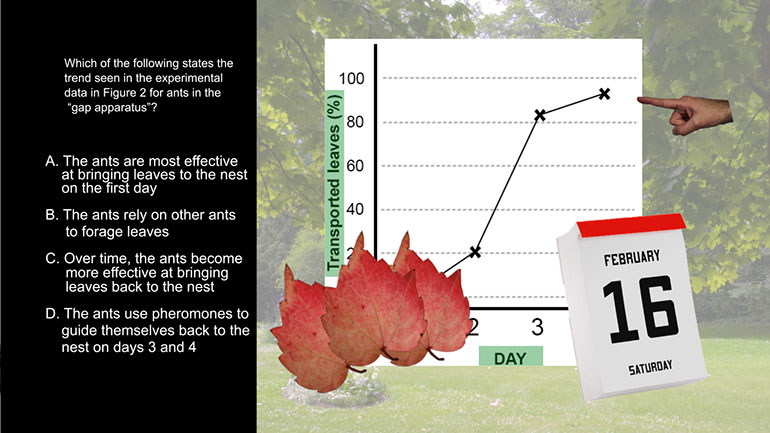
ACT Science: Research Summary Passage Drill 3, Problem 4. Which of the following states the trend seen in the experimental data in Figure 2 for ants in the "gap apparatus"?
Transcript
- 00:03
We just might have a problem... that you'd understand...
- 00:09
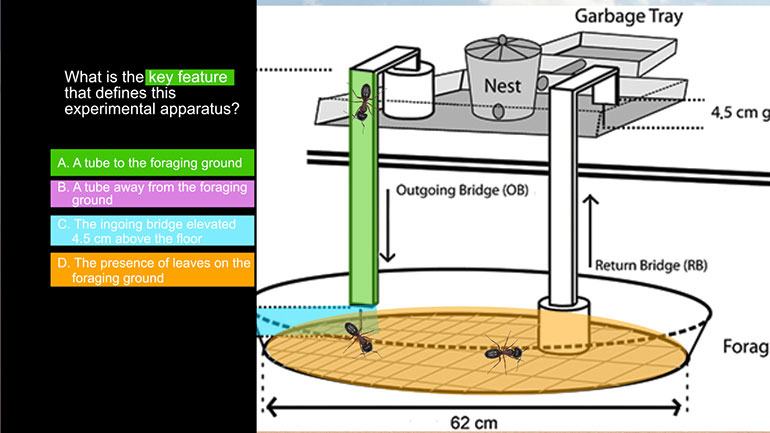
Here's a little experiment for you to try... hit pause and review this... experiment.
- 00:22
Which of the following states the trend seen in the experimental data
- 00:26
in Figure 2 for ants in the "gap apparatus"?
- 00:30
And here are the potential answers...
Full Transcript
- 00:35
Ok, so for this question, we have to use our knowledge about graphs.
- 00:39
First things first. The axis titles.
- 00:42
Titles are our best friends because they tell us exactly what the graph is about.
- 00:46
The x axis represents days, and the y axis represents the percentage of transported leaves.
- 00:53
So... our trend has to somehow relate to days and leaves.
- 00:57
That means we can cross off option B...since the graph doesn't say anything about lazy
- 01:01
ants who rely on others to forage leaves...
- 01:04
...and option D, which says that the ants use pheromones
- 01:07
to guide themselves back to the nest on day 3 and 4.
- 01:11
The ants may or may not use pheromones...but we don't care... not for this question, at least.
- 01:15
Right now, all we're concerned with is days and leaves.
- 01:19
Well, both options A and C are about days and leaves.
- 01:21
But...option A says that the ants are the most effective at bringing leaves to the nest
- 01:26
on the first day.
- 01:28
One look at the graph...and we can immediately cross off option A.
- 01:31
The ants were the least effective at carrying leaves on day 1.
- 01:35
They carried... nada. So option A is out.
- 01:39
Which leaves us only with option C.
- 01:40
The trend of the graph is that over time,
- 01:43
the ants become more effective at bringing leaves to the nest.
- 01:47
Guess this would be a leaf of absence.
Related Videos
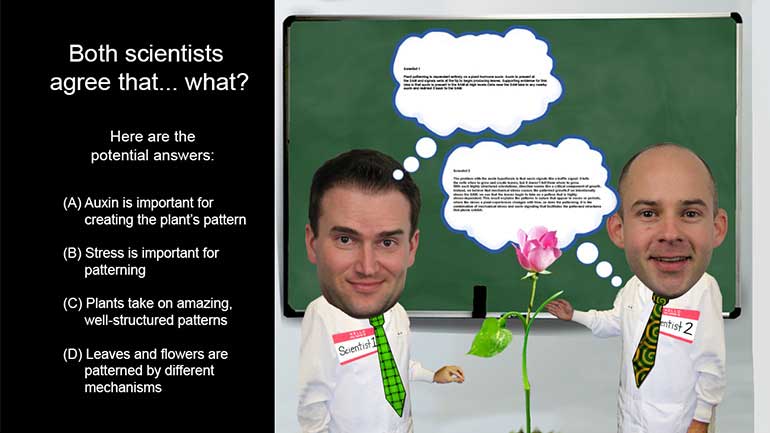
ACT Science: Conflicting Viewpoint Passage Drill 1, Problem 1. What statement would both scientists agree upon?
ACT Science: Research Summary Passage Drill 2, Problem 1. Why do you think that the filter paper will not remove the salt from the water?
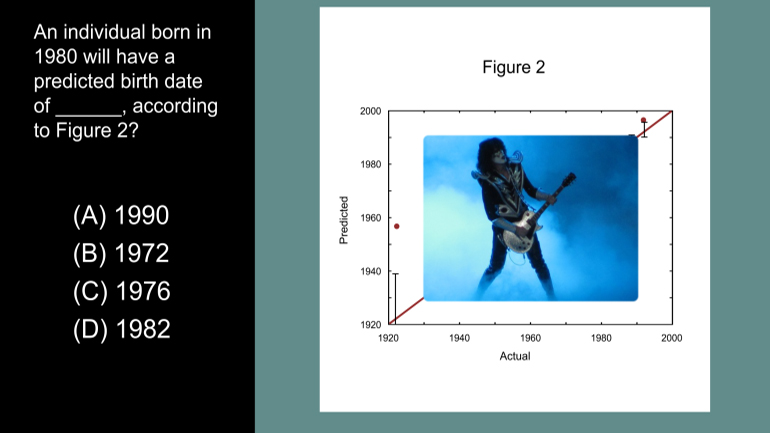
ACT Science Data Representation Passage: Drill 3, Problem 5. According to Figure 2, what birth date will be predicted for an individual actual...
ACT Science: Data Representation Passage Drill 1, Problem 2. Which of the following is a variable in Figure 1, but not in Figure 2?
ACT Science: Data Representation Passage Drill 1, Problem 1. What do the statistics in Figure 1 suggest?
