ShmoopTube
Where Monty Python meets your 10th grade teacher.
Search Thousands of Shmoop Videos
PSAT® Math
Play All
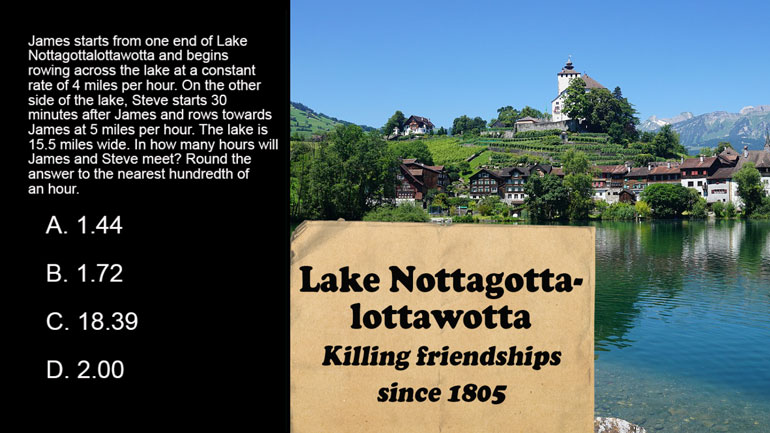
PSAT 1.1 Math Narrative Walkthrough. In how many hours will James and Steve meet?
PSAT 1.2 Math Narrative Walkthrough. Which graph represents the equation?
PSAT 1.3 Math Narrative Walkthrough. How many full packages of secret ingredient does the company have to buy to make one 50-gallon batch?
PSAT 1.6 Math Narrative Walkthrough. What's the best way to rearrange the Combined Gas Law to isolate the unknown?
PSAT 1.7 Math Narrative Walkthrough. How tall would the boxes have to be?
PSAT 1.8 Math Narrative Walkthrough. Which description of a circle corresponds to the equation?
PSAT 1.10 Math Diagnostic. Which of the following is a factor of the expression?
PSAT 1.12 Math Diagnostic. Which of the following graphs best models the relationship between anemone toxicity x and the number of clownfish y?
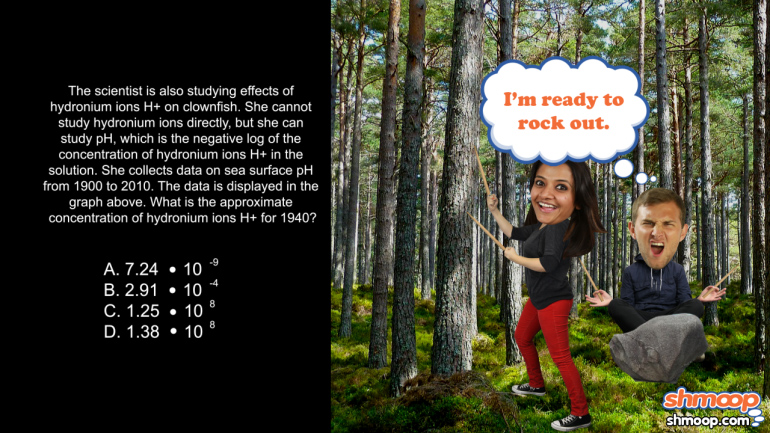
PSAT 1.13 Math Diagnostic. What is the approximate concentration of hydronium ions?
PSAT 1.14 Math Diagnostic. What value of b will make x have an imaginary component?
PSAT 1.15 Math Diagnostic. Which function represents the GDP of South Asia at time t for t equals 15?
PSAT 1.16 Math Diagnostic. What is the maximum number of pounds of Type A that Malcolm should buy?
PSAT 1.17 Math Diagnostic. Which of the following functions models the number of E. coli bacteria at time h?
PSAT 1.18 Math Diagnostic. Which of the following graphs models the population growth rate of Salmonella in the petri dish?
PSAT 1.2 Math Diagnostic. After two years, how much money will Eduardo have?
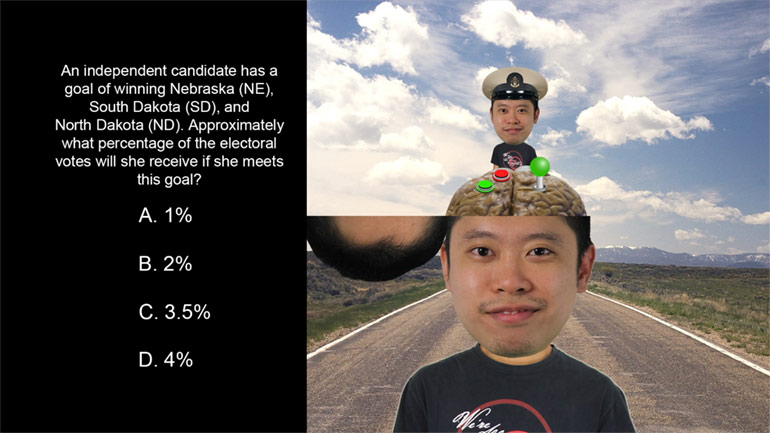
PSAT 1.20 Math Diagnostic. Approximately what percentage of the electoral votes will she receive if she meets this goal?
PSAT 1.21 Math Diagnostic. The map above shows the electoral votes for the western part of the United States. Which of the following statements is...
