Think you’ve got your head wrapped around Definite Integrals? Put your knowledge to
the test. Good luck — the Stickman is counting on you!
Q. Use a left-hand sum with 3 sub-intervals to estimate the area between f (x) = |x| and the x-axis on the interval [-4, 2].
6
8
10
12
Q. Partial values of the function f are given in the table below.

Use a left-hand sum with the sub-intervals suggested by the data in the table to estimate the area between the graph of f and the x-axis on the interval [1, 8].
26
46
47
52
Q. Determine which formula produces a right-hand sum approximation to the area between f and the x-axis on [1,10].
[f (1) + f ( 2 ) + f (3) + f (4) + f (5) + f (6) + f (7) + f (8) + f (9) + f (10)]Δ x
[f (1) + f (2) + f (3) + f (4) + f (5) + f (6) + f (7) + f (8) + f (9)]Δx
[f (2) + f (3) + f (4) + f (5) + f (6) + f (7) + f (8) + f (9)]Δ x
[f (2) + f (3) + f (4) + f (5) + f (6) + f (7) + f (8) + f (9) + f (10)]Δx
Q. Which of the following statements is true?
If f is increasing on [a, b] then LHS(2) will provide an overestimate for the area between f and the x-axis on [a, b].
If f is increasing on [a, b] then LHS(2) will provide an underestimate for the area between f and the x-axis on [a, b].
If f is decreasing on [a, b] then RHS(2) will provide an overestimate for the area between f and the x-axis on [a, b].
If f is constant on [a, b] then RHS(2) will provide an underestimate for the area between f and the x-axis on [a, b].
Q. Let  and let R be the region between the graph of f and the x-axis on [2, 4]. How many sub-intervals must we use to guarantee that the left-hand sum will be within 0.25 of the exact area of R?
 and let R be the region between the graph of f and the x-axis on [2, 4]. How many sub-intervals must we use to guarantee that the left-hand sum will be within 0.25 of the exact area of R?
 more than 3
more than 4
more than 48
more than 49
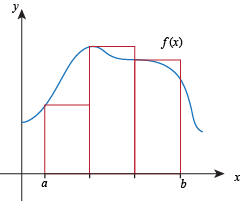
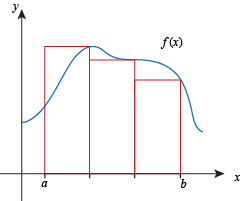
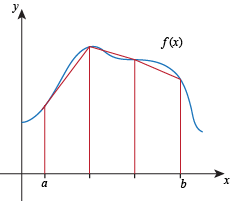
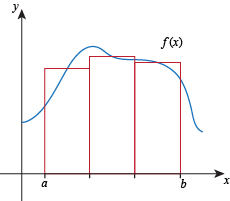
Q. Which picture best illustrates the area accounted for by using MID(3) to approximate the area between f (x) and the x-axis on [a, b]?


Q. Let f (x) = sin x + 1. Use a trapezoid sum with 4 sub-intervals to estimate the area between f and the x-axis on [0, 2π].
π
2π

8π
Q. Partial values of the function f are shown in the table below. We want to estimate the area between f and the x-axis on [0, 4]. We can use the values in the table to find all but one of the following midpoint sums. Which midpoint sum cannot be found using the information in the table?

MID(1)
MID(2)
MID(3)
MID(4)
Q. For which of the following functions f will any midpoint sum give an overestimate of the area between f and the x-axis on [0, 2]?
f (x) = x2

f (x) = x

Q. Let f be a non-negative function that is increasing and concave up. Let R be the region between the graph of f and the x-axis on [a, b]. Which of the following quantities is largest?
The area of R.
LHS(10)
LHS(5)
MID(10)